thankQ Help
As with other data-aware controls, the PivotGrid control requires you to create a number of fields - objects bound to real data source fields. The fields whose data you need to analyse (sales amount in our sample) should be placed in the data area. Then place some fields in the row and column area. For instance, if you wish to know how many models of a particular type were sold on a certain date, you can place the Model and OrderDate fields in those areas.
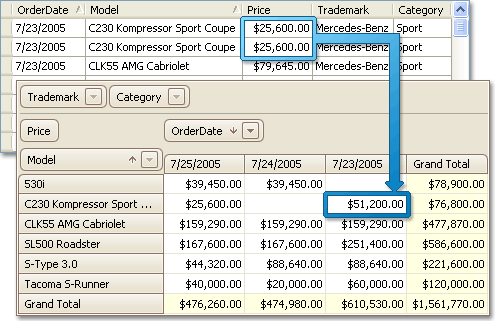
By default, all the unique field values of column and row fields are listed along the control's top and left edges. These values represent column and row headers - the axes of the report. Where each column and row intersect, the PivotGridControl calculates and displays a summary against a data field for a subset of records. All records from this subset have matching values in a column field(s) and row field(s) and these values are identified by the column and row headers.
The image below shows you how raw table data is transformed into a compact report that allows data to be easily analysed.