thankQ Help
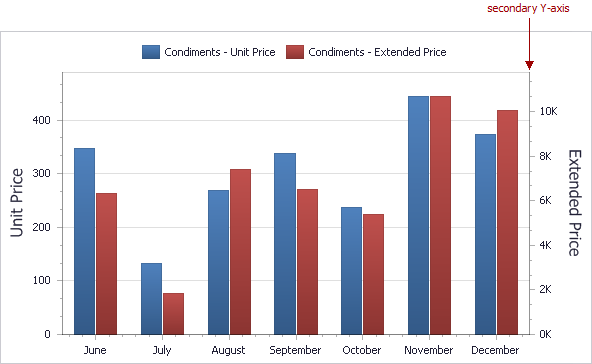
The secondary Y-axis is useful when it is necessary to visually combine several charts into one. Secondary axes provide the ability to plot series with different ranges on the same chart.
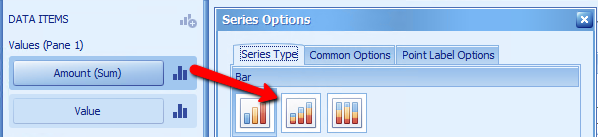
1.Click the Options button beside Amount under Values
2.Click on the Stacked Bar
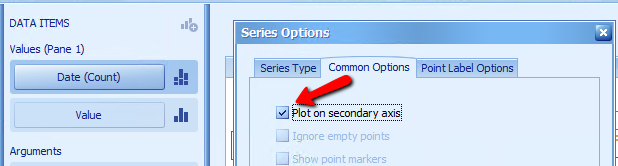
3.Click on the Common Options tab
4.Click into the Plot on secondary axis tick box
If you were using this option you would have two Values e.g. Price and Extended Price