thankQ Help
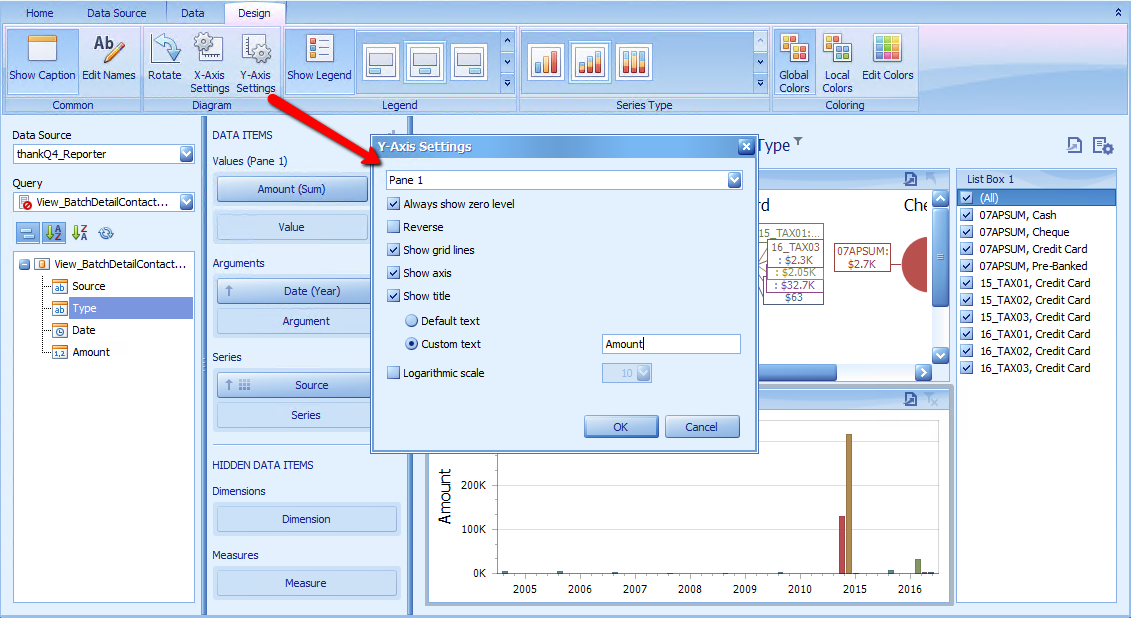
1.Click the Y-Axis Settings button in the Diagram section of the Design tab
2.Select Custom text and remove (sum) from Amount, click OK
Always show zero level |
Specifies whether or not the axis' zero level is visible. If this option is unchecked, the visible axis range is defined based on the values plotted in the chart. |
Reverse |
Allows you to reverse the Y-axis. If the Y-axis is reversed, its values are ordered from top to down. |
Show grid lines |
Allows you to hide and show grid lines for the Y-axis. |
Show Y-axis |
Allows you to hide and show the Y-axis. |
Show title |
Allows you to hide and show the Y-axis title. You can choose whether to use the default text or specify a custom string. |
Logarithmic scale |
Specifies whether or not the axis should display its numerical values using a logarithmic scale. The combo box next to this option allows you to select the logarithmic base from one of the predefined values. |