thankQ Help
In the following image you can see two Pivot Grid controls. The first one displays the original data before it is grouped, and the second Pivot Grid control groups values of the Order Date column field by months.
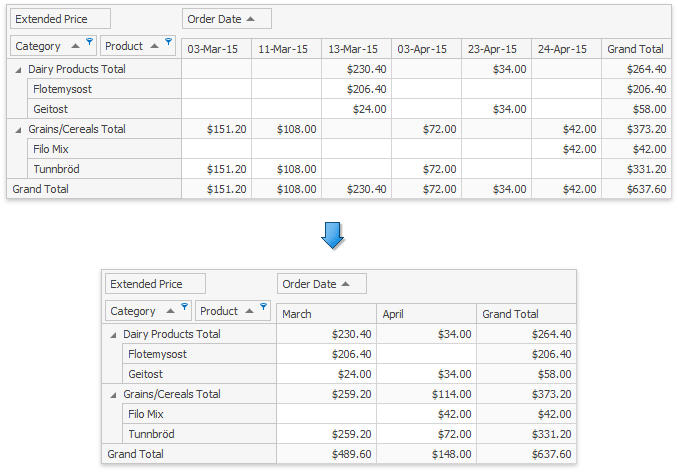
Each column in the second Pivot Grid groups values of appropriate columns in the first Pivot Grid. For instance, values in the March column shows a group of the first three columns values from the first Pivot Grid.
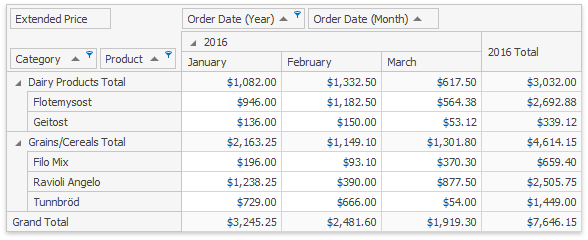
You can bind the Pivot Grid fields to the same field in an underlying data source and group the values of these fields independently. For example, you can combine date/time data by years, months, quarters and so on. The image below shows the Pivot Grid, where the first Order Date field is grouped by years, and the second field values - by months: