thankQ Help
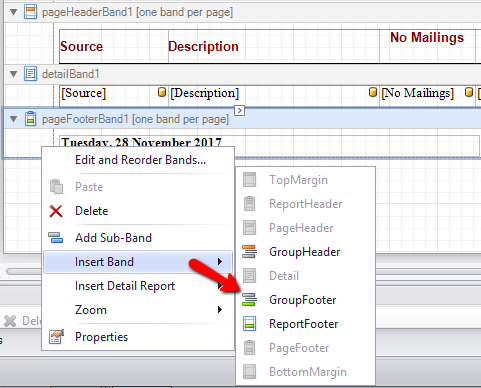
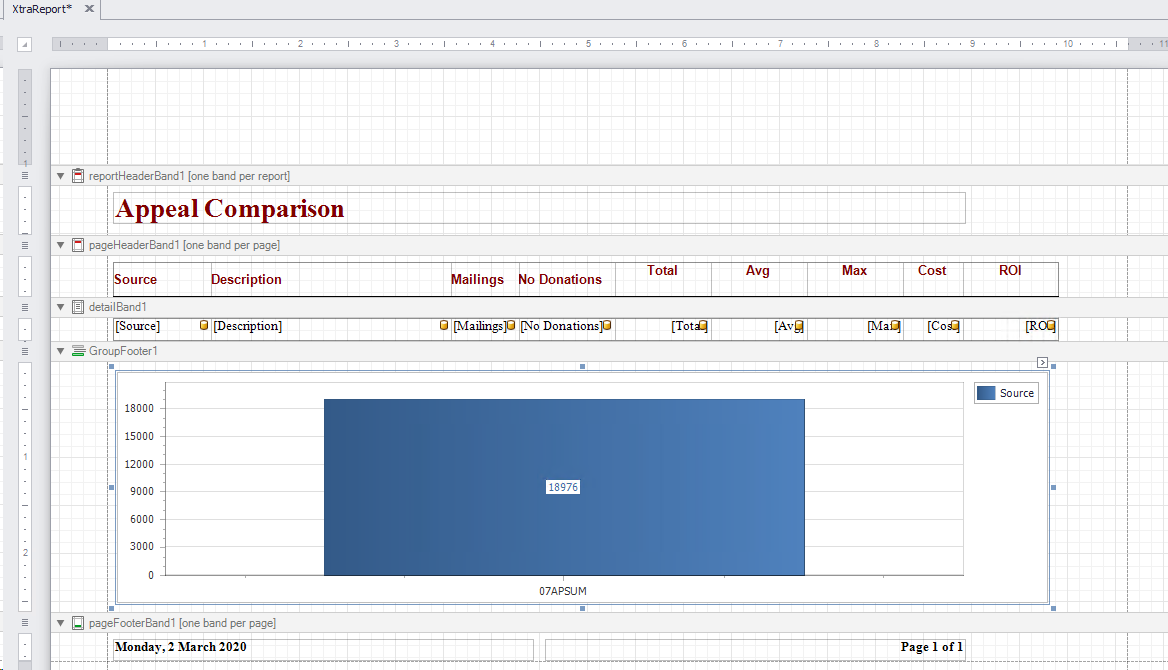
1.Right click and Insert Band GroupFooter
2.Grab the double arrow at the bottom of the GroupFooter and drag down to enlarge
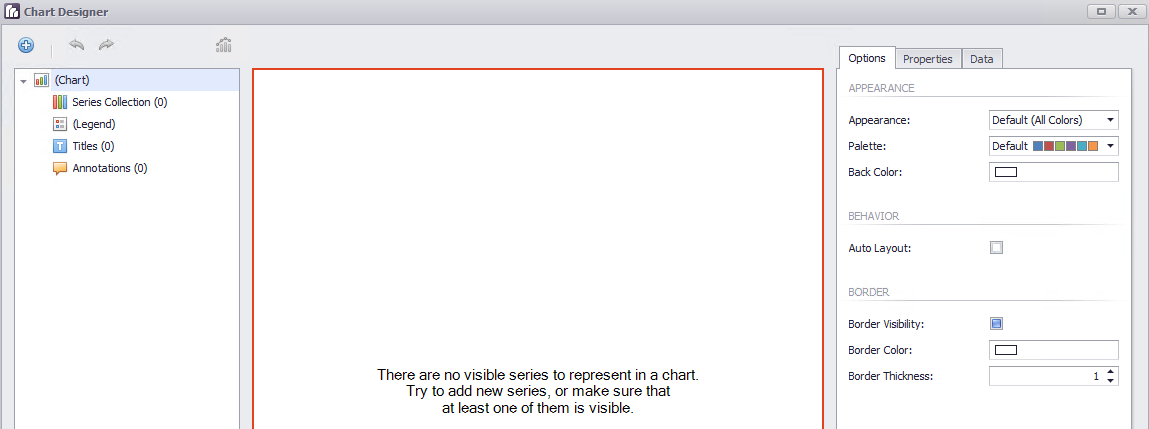
3.Drag the Chart icon from the Tool Box to the GroupFooter
This will open the Chart Designer window
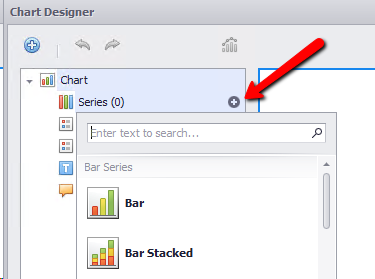
4.Click the + beside Series Collection (0) and select the desired Chart design
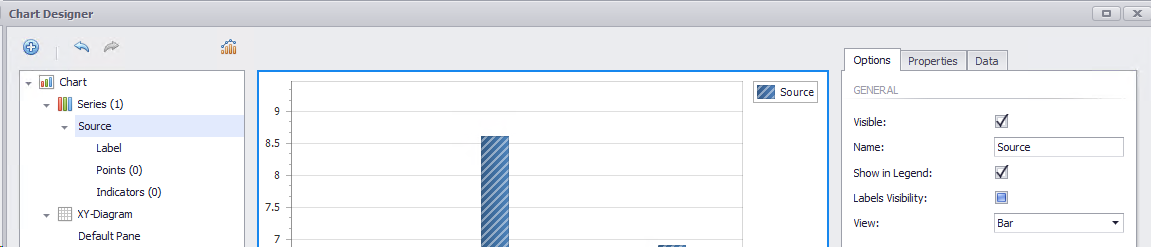
5.Change the name to Source
6.Untick Visible or Show In Legend if these are not applicable
7.Click the Data tab
8.Open the Tbl_SourceCodeAttribute table
9.Drag Source to the Argument button
10.Drag Total to the Value button
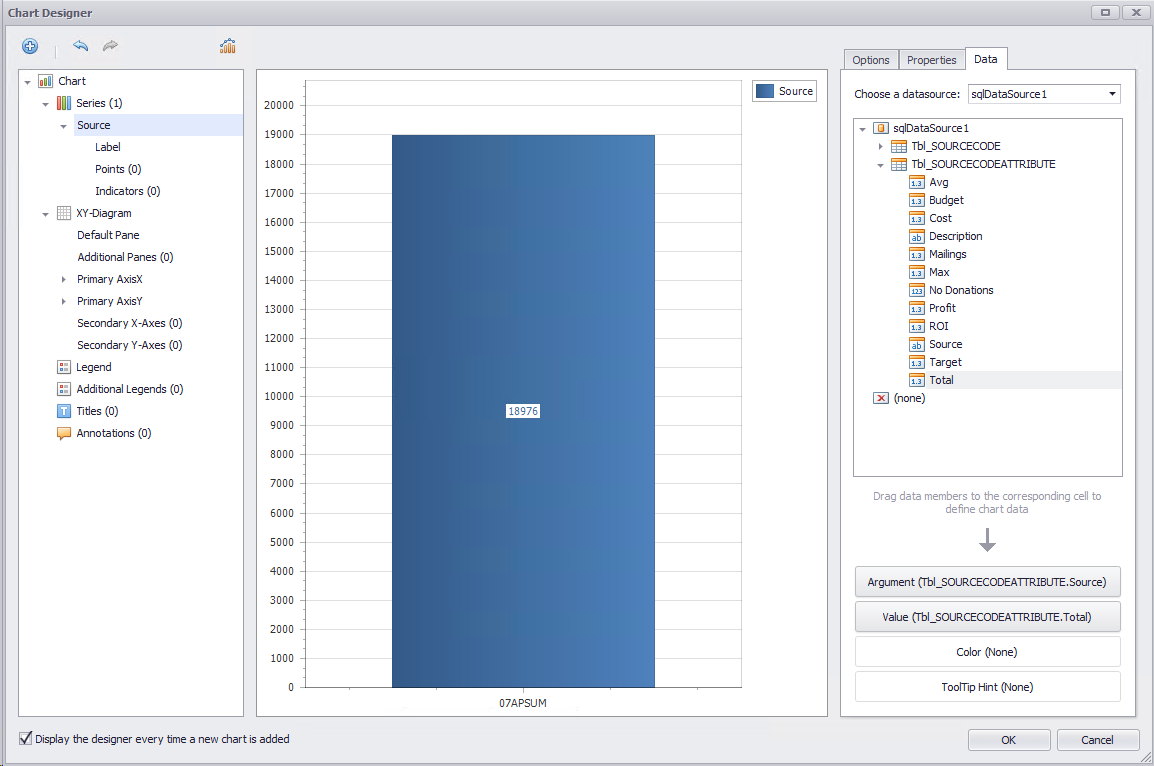
11.Click the X top right to exit, Click Save
12.Resize the Chart in the Group Footer window
13.Click Print Preview, select the Source codes and Submit
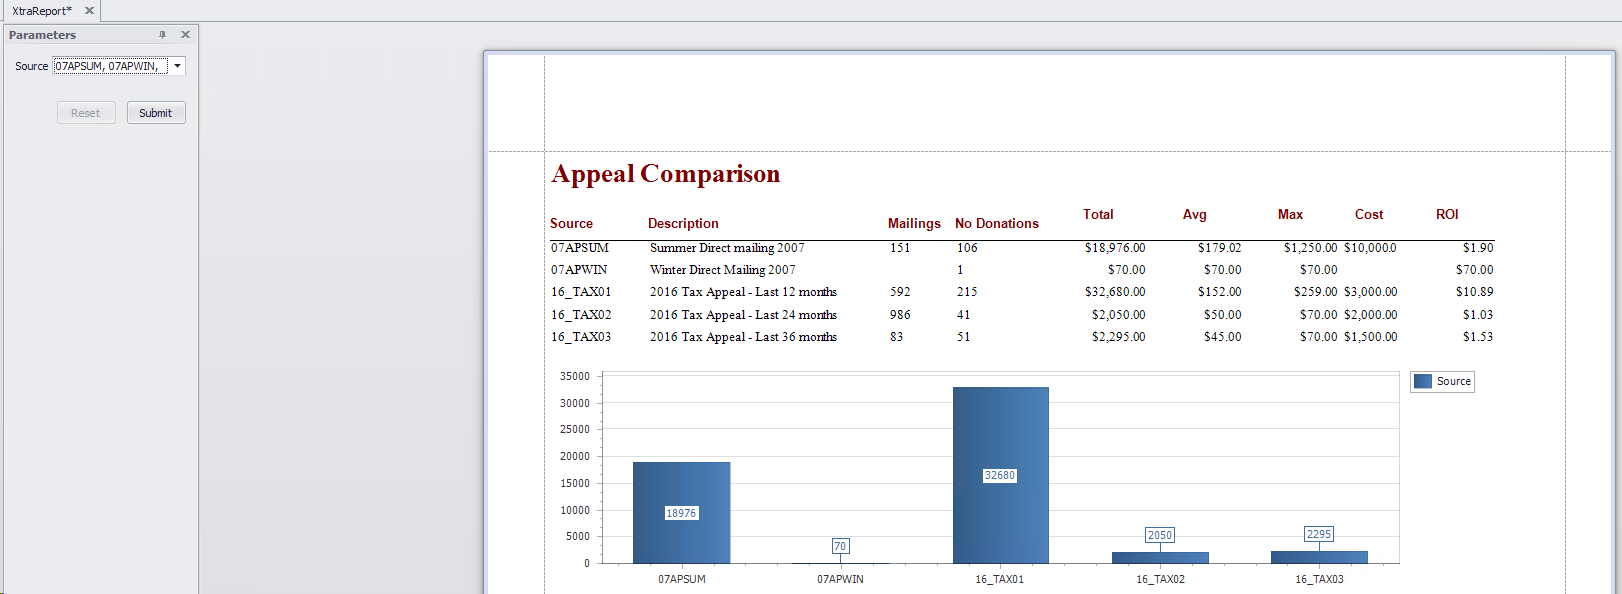
14.Click Save under the Report Designer tab and click OK