thankQ Help
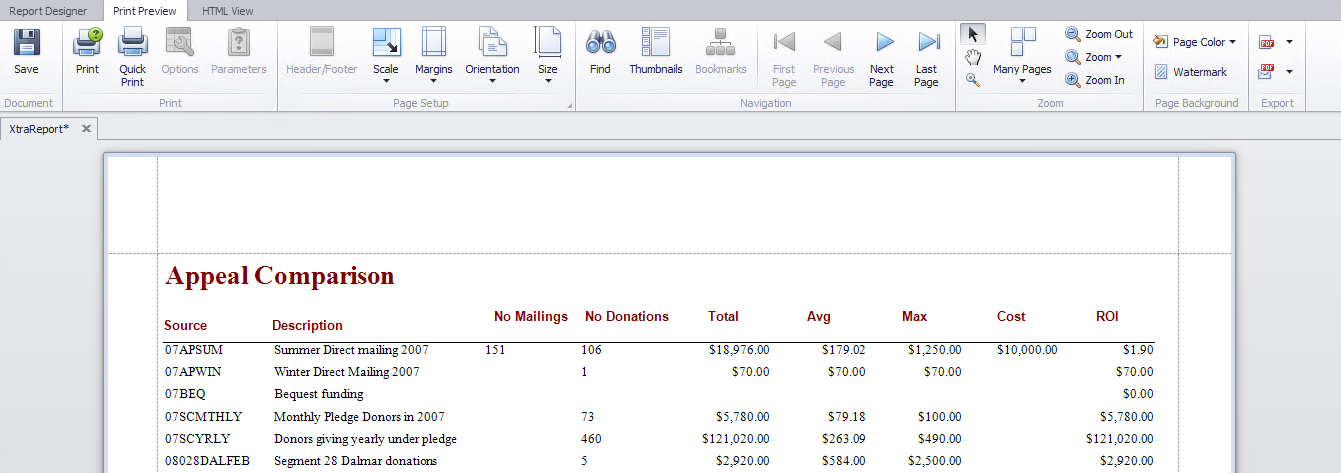
This report displays information captured for segmented mailings and donations received per segment.
The Source codes that are linked to each segment should have Target and Budget information included.
1.Create a User Defined Report using the Report Wizard
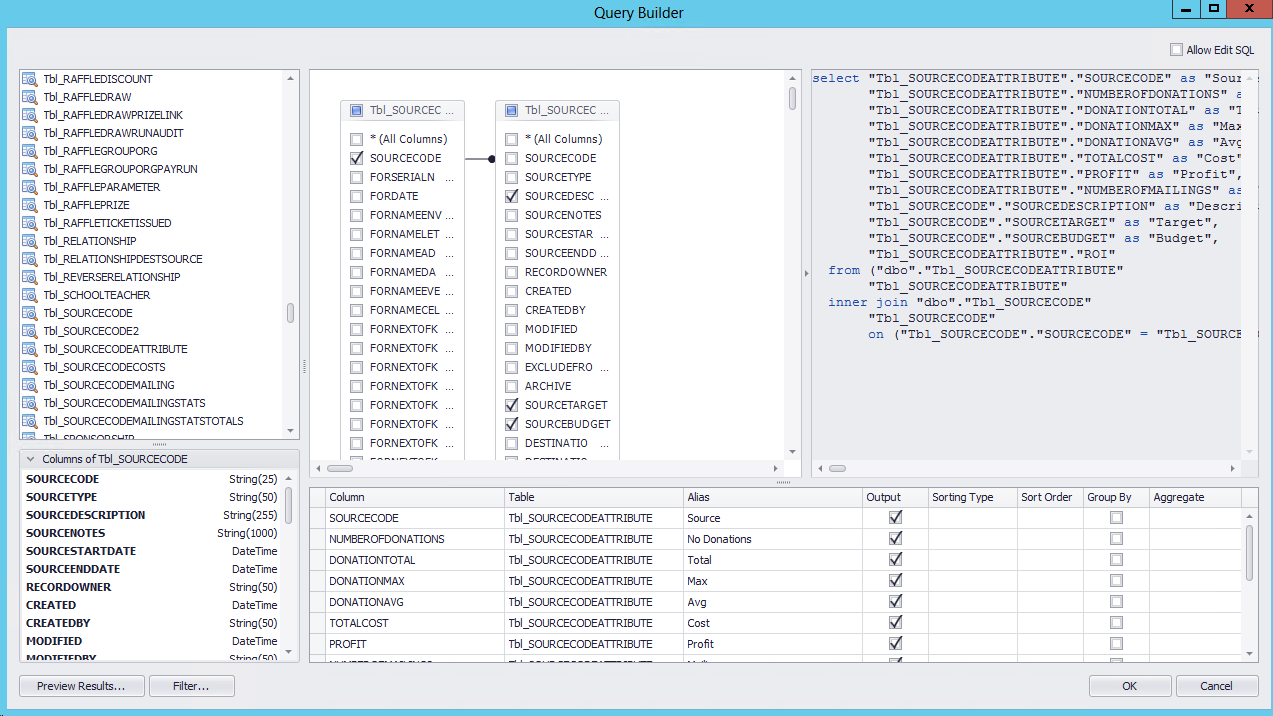
2.Run Query Builder on Report Wizard
3.Select Tbl_SourceCodeAttribute
4.Select the following fields:
Source Code |
Total Cost |
Number of Donations |
Profit |
Donation Total |
ROI |
Donation Max |
Number of Mailings |
Donation Average |
|
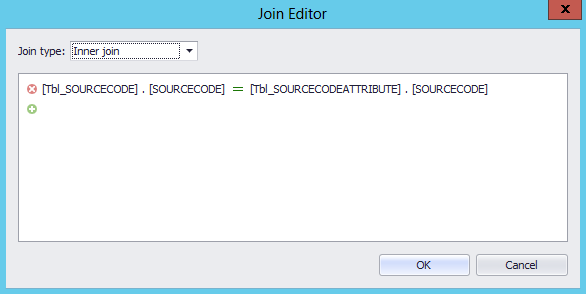
5.Select Tbl_SourceCode
6.Use an Inner Join and join using the Source Code
7.Select the following fields:
Source Description
Source Target
Source Budget
8.Enter Alias names
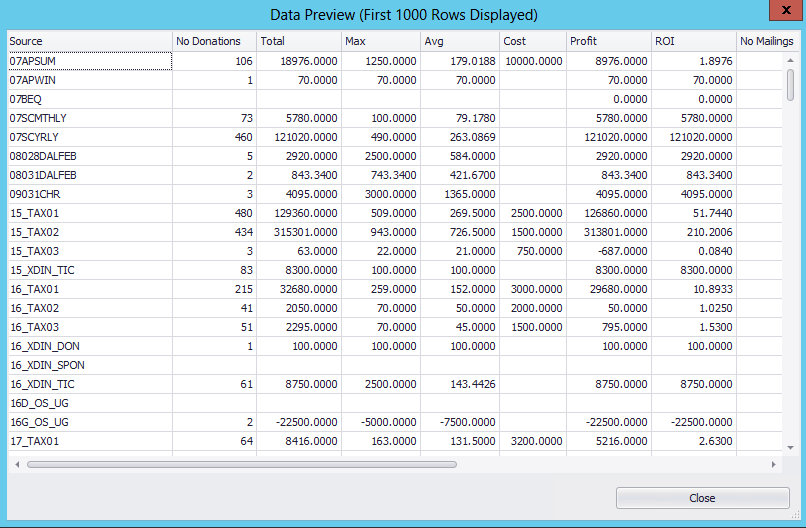
9.Click Preview Results
10.Click Close
11.Click OK on Query Builder
12.Click Next on Report Wizard
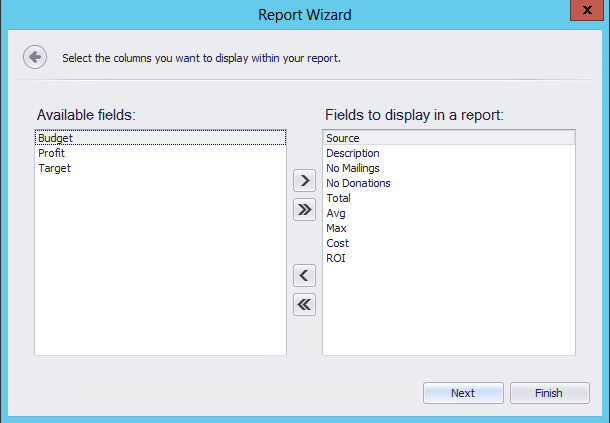
13.Double click on the fields in the order you want them to appear in the report
14.Click Next
15.Click Next
16.Select Landscape Tabular for the Layout
17.Click Next
18.Select a Style
19.Click Next
20.Enter a Name for the Title e.g. Appeal Comparison
21.Click Finish
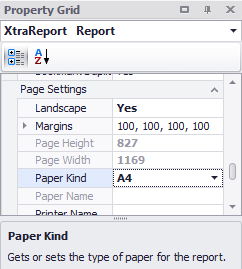
22.Change Paper Kind to A4 under Page Settings under the Property Grid of XtraReport
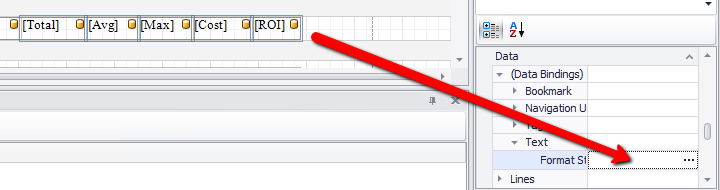
23.Hold down the Ctrl key and click on Total, Avg, Max, Cost and ROI
24.Under the Property Grid locate Data and open (Data Bindings)
25.Open Text and click on the … (ellipsis) beside Format String
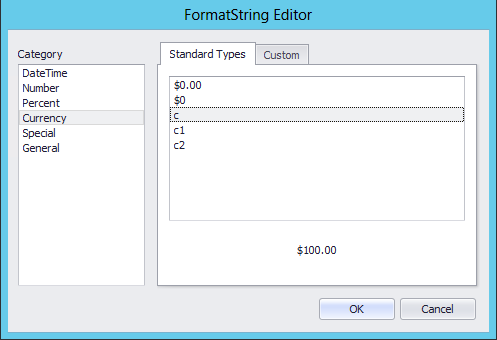
26.Change the Amount fields to Currency c
27.Click OK
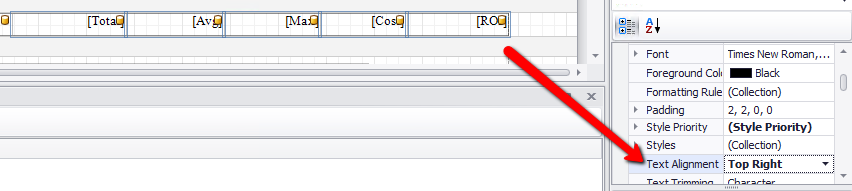
28.With the Amount fields still selected change the Text Alignment to Right in the Property Grid
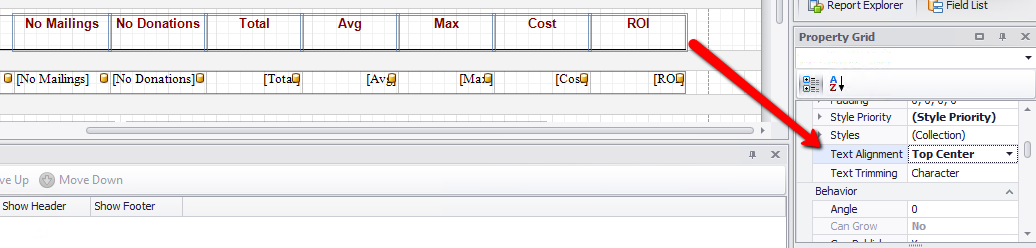
29.Select the Label fields and change to Top Centre
30.Use the Ctrl to select the Description fields
31.Change the Width in the Property Grid to 220
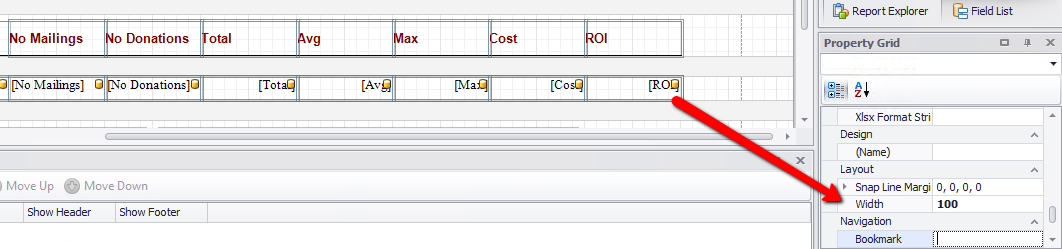
32.Select the fields that will include numbers
33.Locate Width in the Property Grid and enter 100
34.Make any further changes to fields and margins and any other formatting required
35.Click Print Preview to view how the report will look