thankQ Help
Groups can be used so you can have different lists and displays on the same page
1.Click Group on ribbon under Home tab
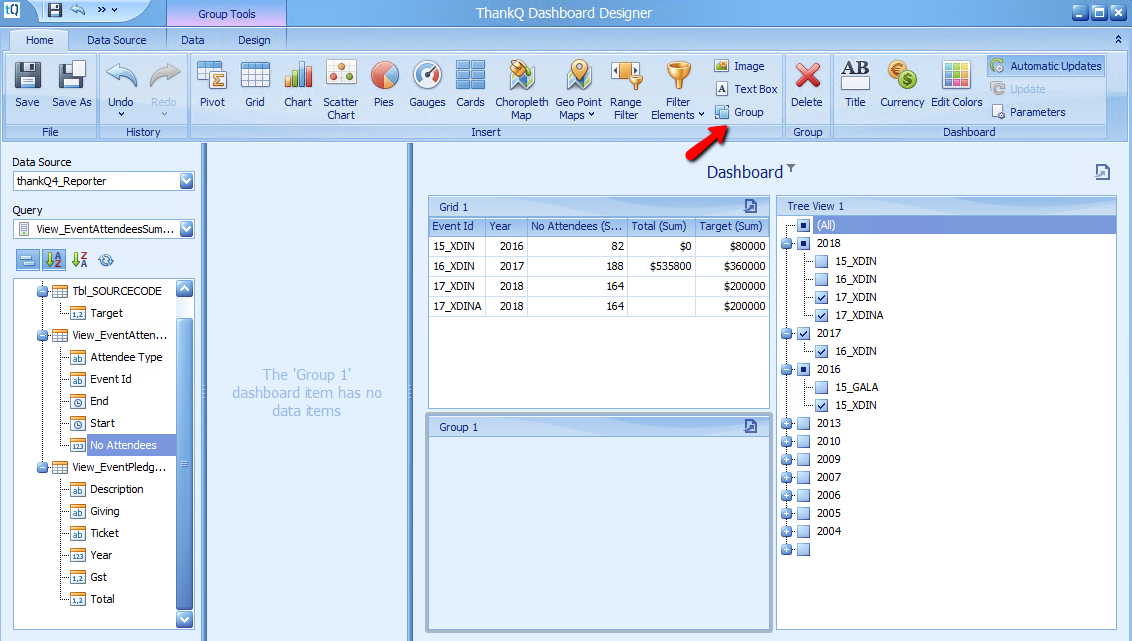
2.Drag the Grid and Tree View into the Group
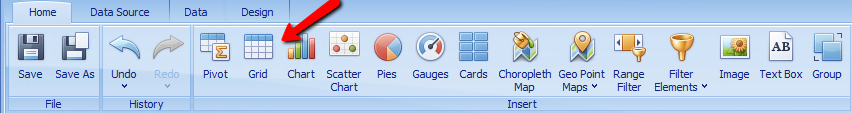
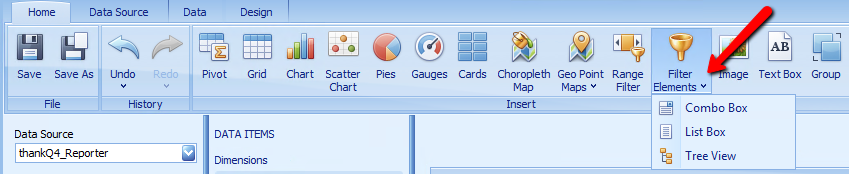
3.Click Chart on the tool bar and drag inbetween the Grid and Tree View
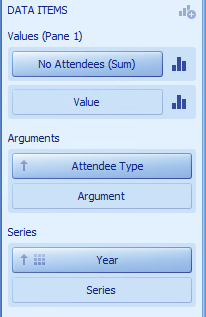
4.Drag No Attendees to Values
5.Drag Attemdee Type to Arguments
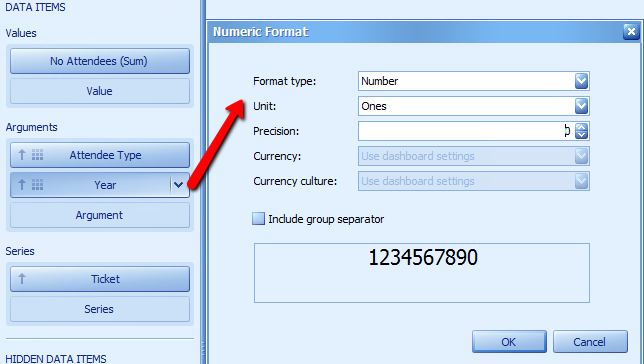
6.Drag Year to Series
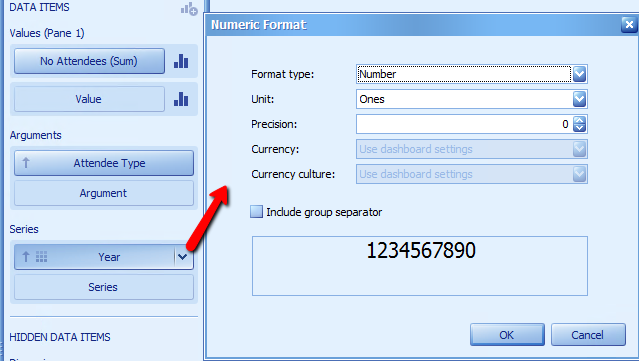
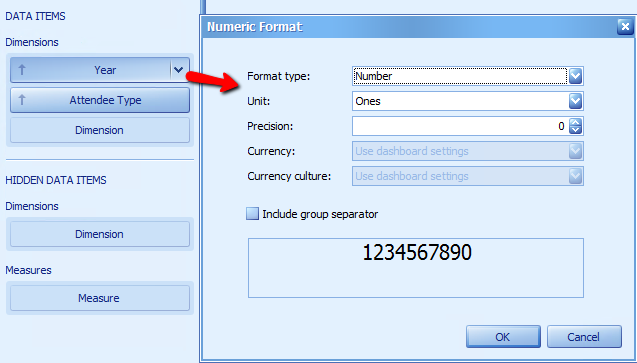
7.Change Year format to Number
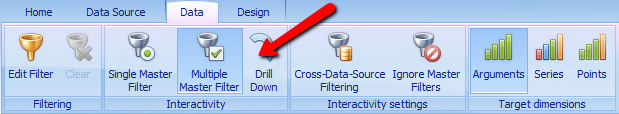
8.Activate Multiple Master Filter from the Data tab
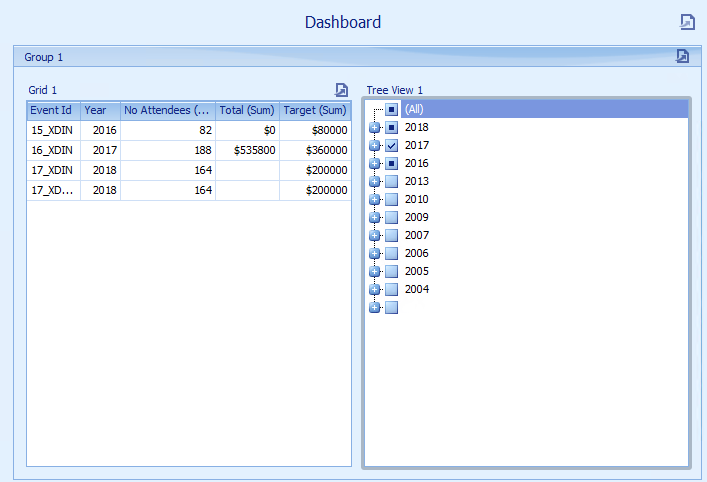
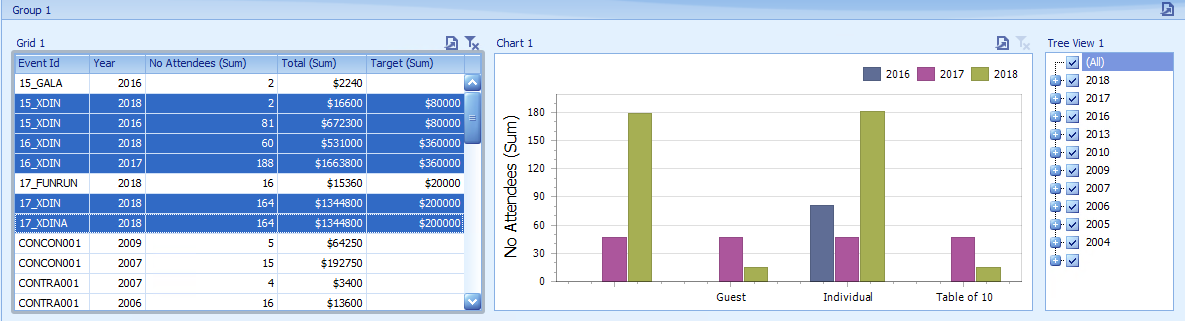
9.Hold down the CTRL key and select some Event Id’s on the Grid. This will change the Chart accordingly
10.Click the Group icon again to create another Group
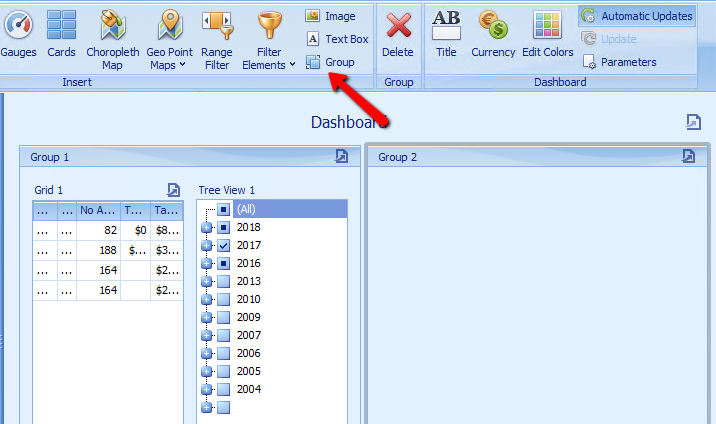
11.Reposition using right click Show Caption to get the move icon and move under Group 1
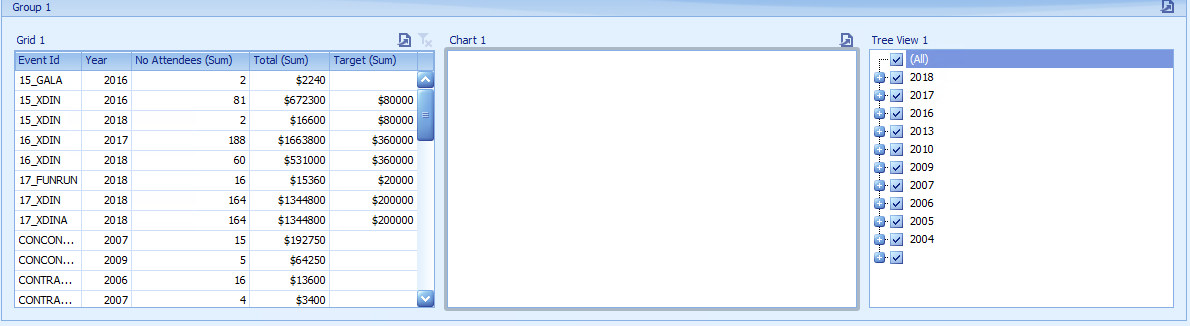
12.Click Grid on tool bar and drag into Group 2
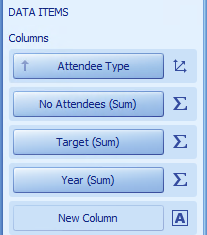
13.Add to Grid
Attendee Type
No Attendees
Target
Year
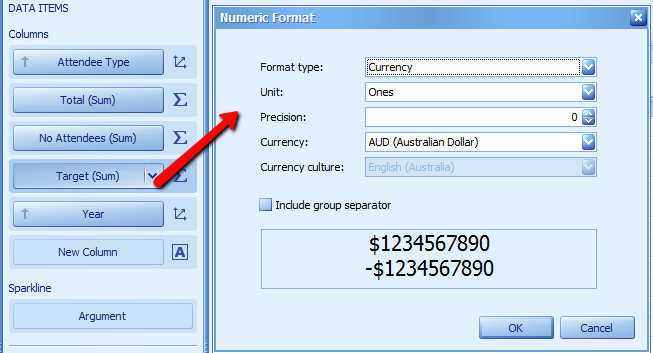
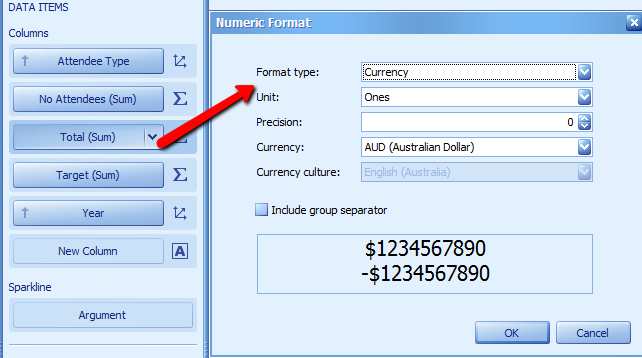
14.Change Target to show whole sum by changing Format to Currency
15.Change Year format and Dimension
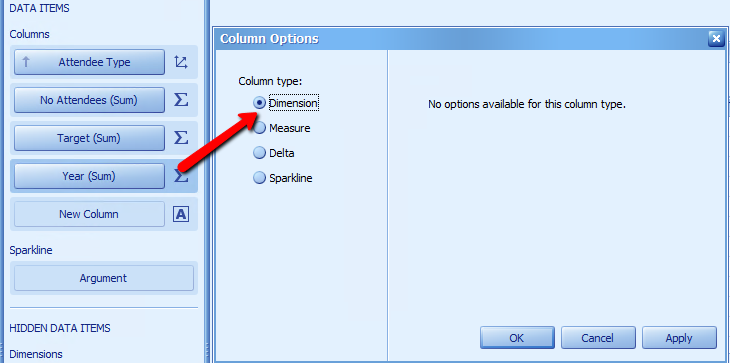
We want to add another field to the Data Items
16.Drag Total in between No Attendees and Target
17.Change Format to Currency
18.Add a Tree View filter from the Filter Elements icon and drag into Group 2
19.Drag Year and Attendee Type onto Dimensions
20.Change Year format to numbers
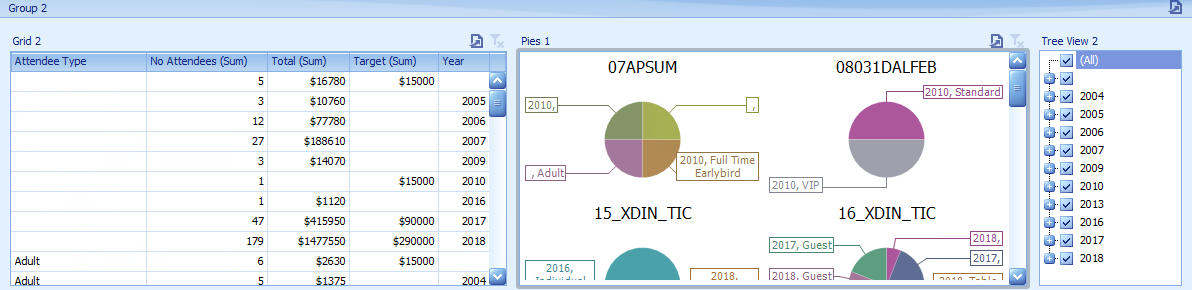
21.Click Pies on the tool bar
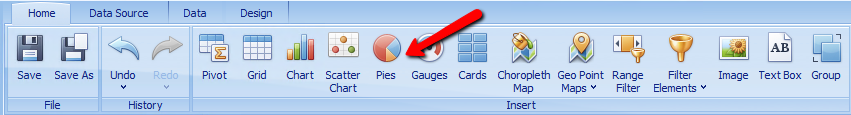
22.Drag into Group 2
23.Drag No Attendees to Values
24.Drag Attendee Type and Year to Arguments
25.Drag Ticket to Series
26.Change the Year format to Number
27.Resize views to fit