thankQ Help
The Range Filter dashboard item allows you to apply filtering to other dashboard items e.g. Date ranges
Video: https://www.youtube.com/watch?v=LHA2WznGCbI
1.Click the Range Filter icon under the Home tab
2.Drag the Range Filter above the Pivot table
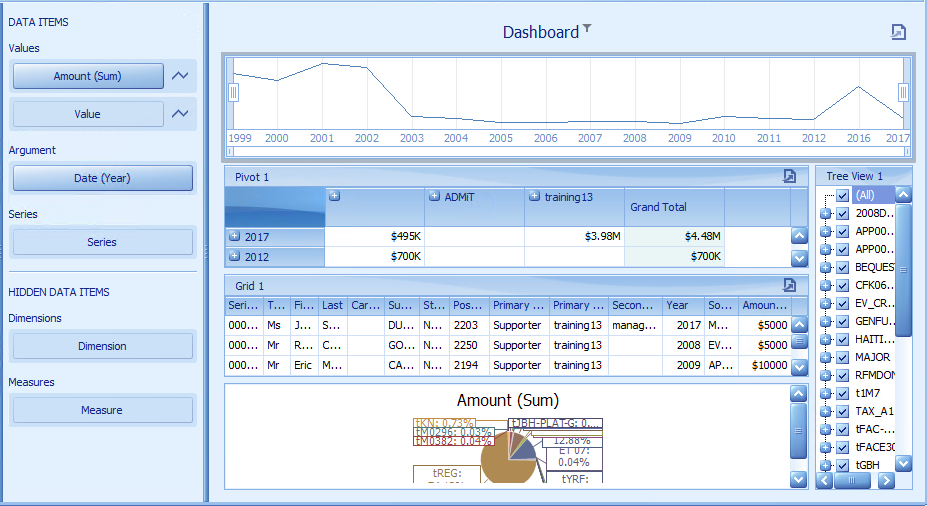
3.Drag Amount to Values and Date to Argument
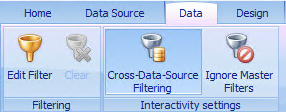
4.Click Cross-Data-Source Filtering under the Data tab so all dashboard items respond to the Range Filter
5.Click Ignore Master Filters if this is active
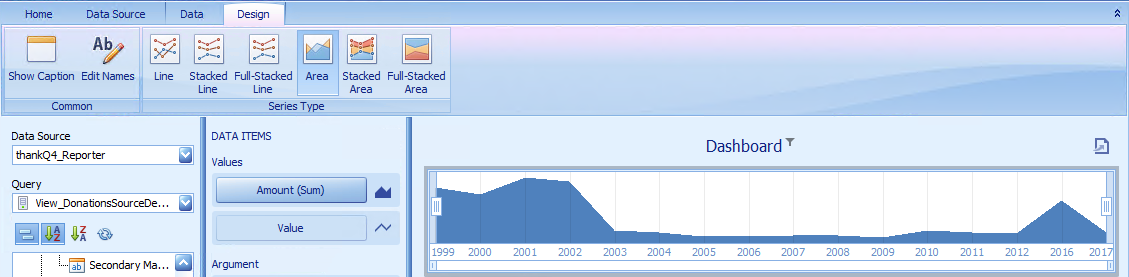
6.Click Area under Design to fill in the graph area
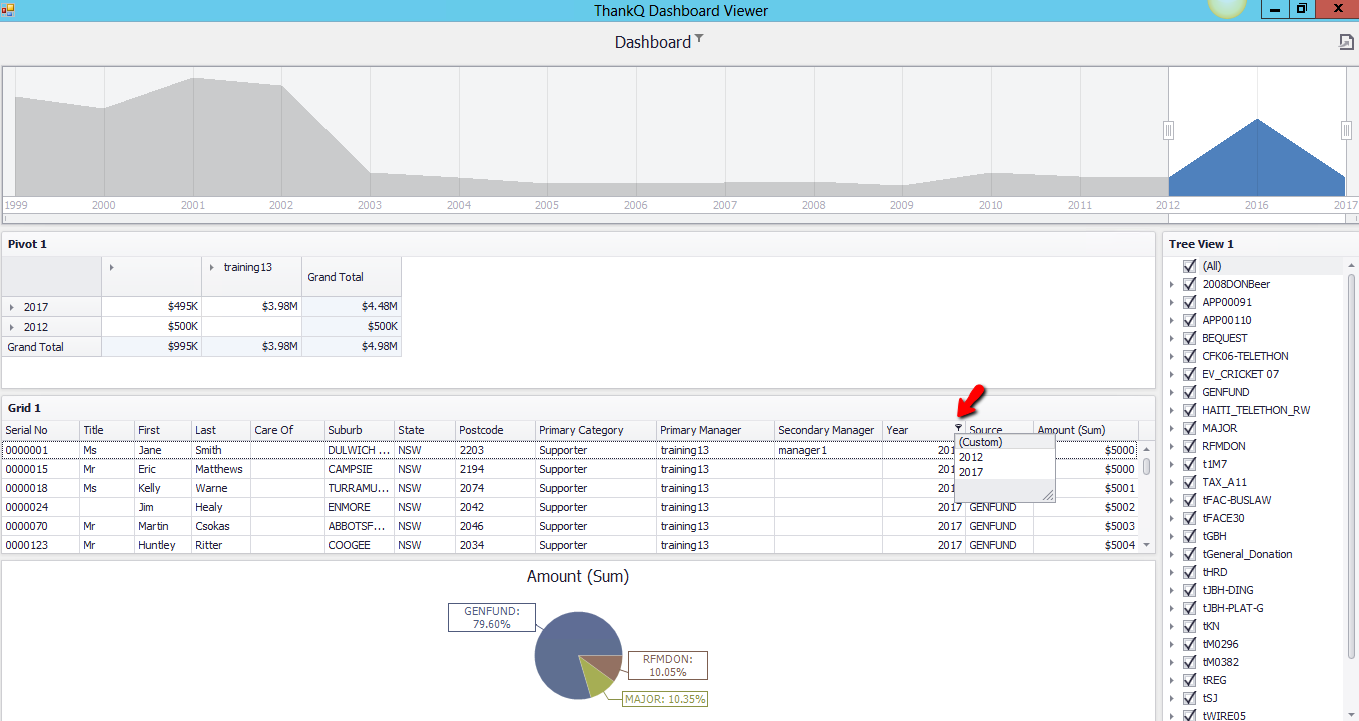
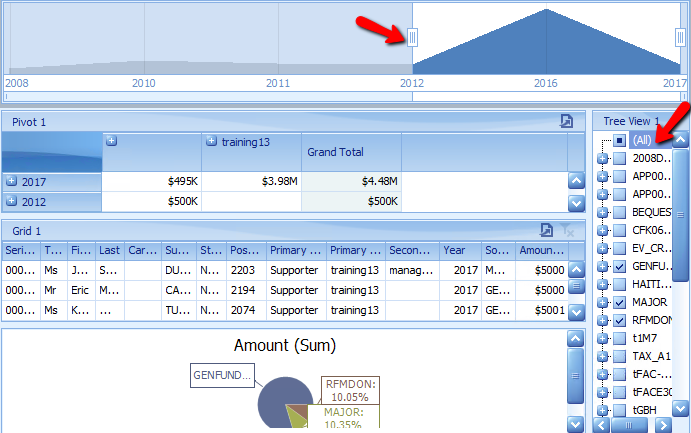
7.Use the scroll holders to slide and update the dashboard to the selected year period
8.Unselect the Tree View and select some different source codes
Example from Dashboard Viewer