thankQ Help
If you did not want to use the existing filters these can be switched off by selecting Ignore Master Filters under the Data tab
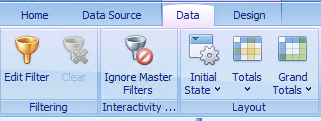
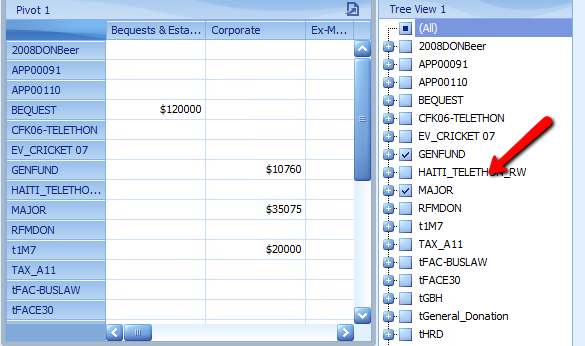
If set to Ignore Master Filters the Sources selected under Tree View will be ignored
1.Click Pivot on the ribbon under the Home tab
2.Drag Amount to Values under Data Items
3.Drag Primary Category to Columns
4.Drag Source to Rows
5.Drag Primary Manager and Secondary Manager under Rows – this will allow you to expand the Source codes to view the totals by each Primary and/or Secondary Manager
6.Drag and reposition the Pivot window above the Grid
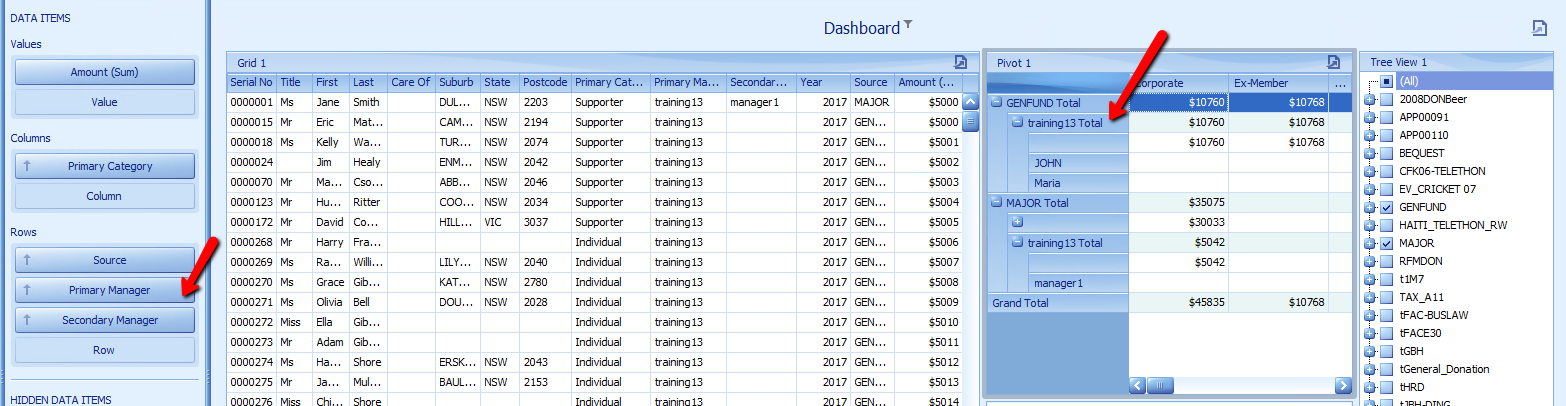
Another option is to have the Year, Source and Primary Category down the left (Rows) and the Primary and Secondary Managers as column headers (Columns) and Amounts under each (Values).
7.Drag the Values, Columns and Rows into position as per below
8.Click the drop down beside Year to change the format to General
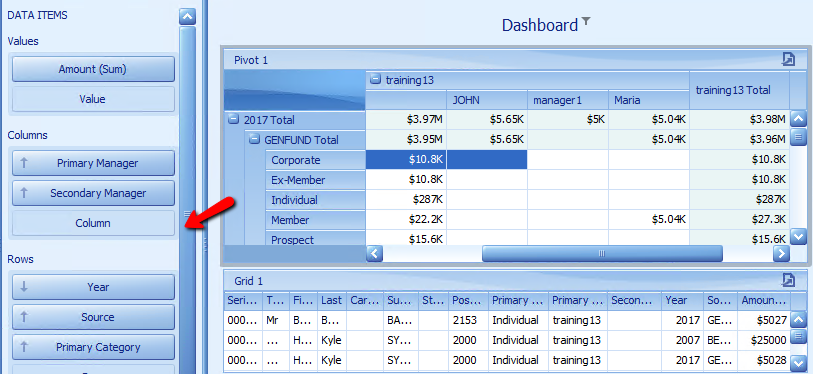
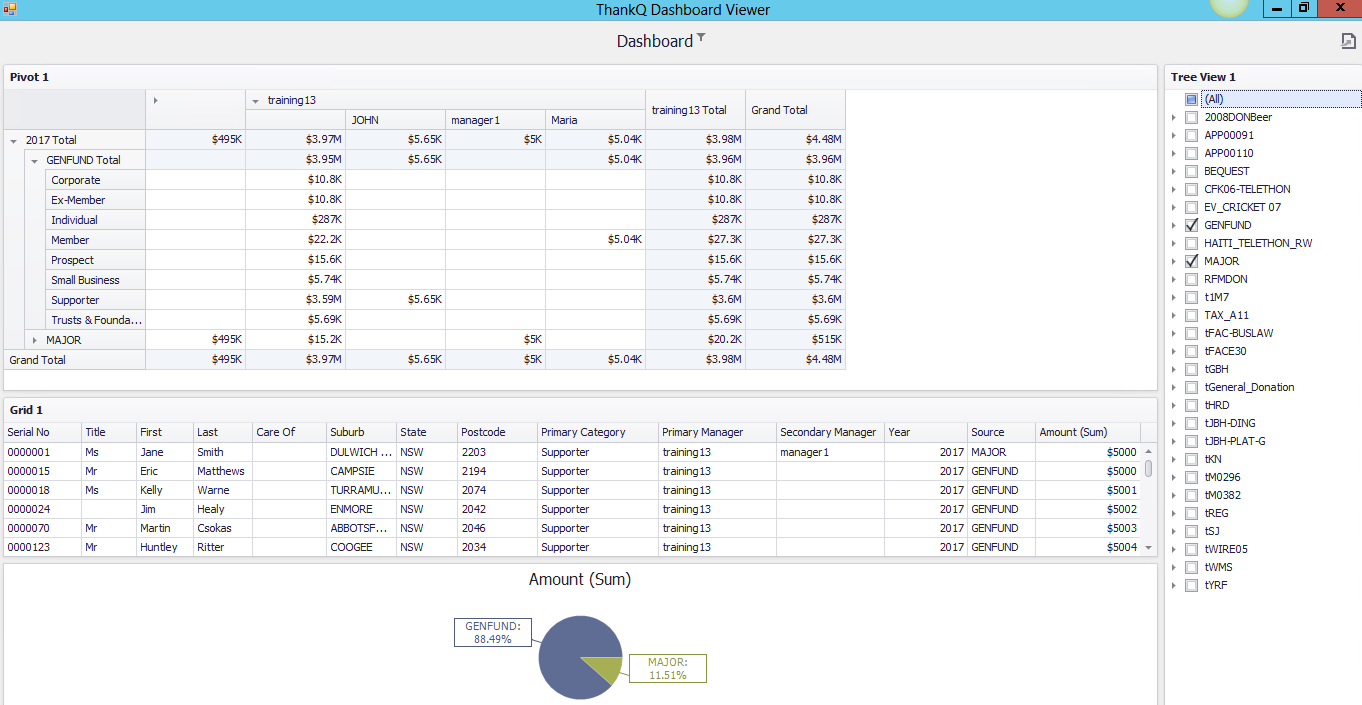
Example of the Dashboard Viewer