Navigation: CUSTOM REPORTING > TQ Dashboard > Donated 5K and Over
Add a Pie Chart
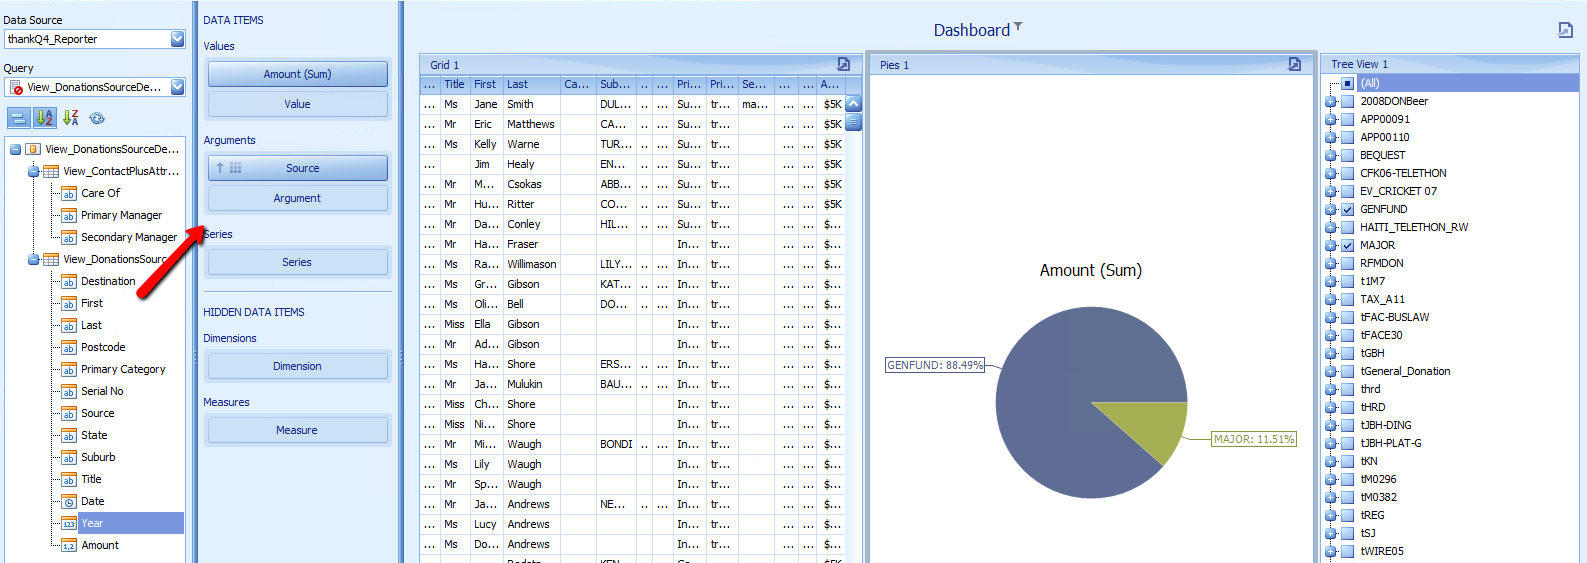
Use a Pie Chart to view the difference between each Source code
1.Click Pies on the ribbon under the Home tab
2.Drag Amount to Values under Data Items
3.Drag Source to Arguments