thankQ Help
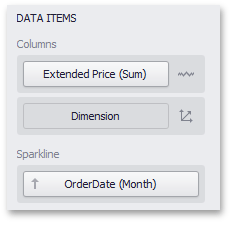
The Grid dashboard item supports four types of columns. When you drop a data item into the Columns section, the type for the new column is determined automatically based on the data type.
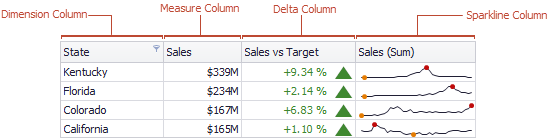
Dimension Column
The dimension column displays values from the bound data item "as is".
If the dimension column is bound to a data source containing images, it can display images.
Measure Column
Displays summaries calculated against data in the bound data item.
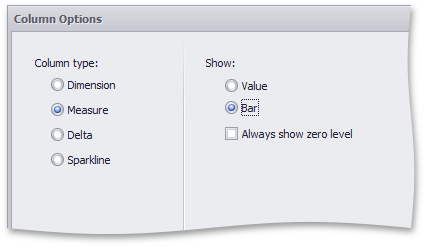
Values in the measure column can be displayed as text or represented by bars.

To select between these modes, invoke the Column Options window and select Value or Bar.
If bars are displayed, use the Always show zero level check box to specify whether the bar's zero level is always visible.
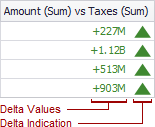
Delta Column
A delta column calculates summaries against two measures, and displays the difference between these summaries. This difference can be communicated via a numeric value displayed within the delta element and an additional delta indication.
Sparkline Column
A sparkline column visualises the variation of summary values over time.
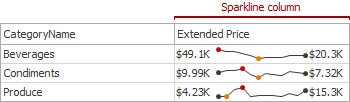
The sparkline column is bound to the measure providing sparkline values and to the dimension providing a date-time interval.
You can control sparkline appearance settings using the Column Options dialog. To invoke this dialog, click the column type indicator 
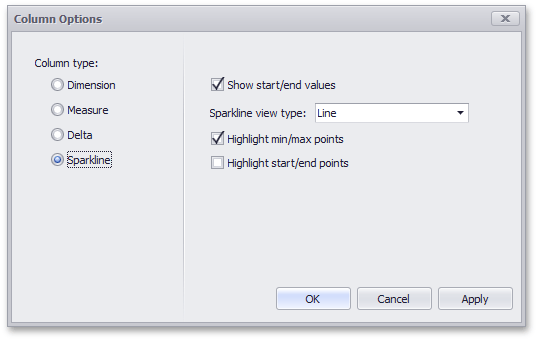
In this dialog, you can control various settings that affect how the sparkline is displayed within a grid cell.
Sparkline Options |
Description |
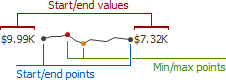
Show start/end values |
Species whether or not to display sparkline start/end values within a grid cell |
Sparkline view type |
Defines the view type of a sparkline. Sparkline data points can be represented as area, line, bars, or win and loss squares. |
Highlight min/max points |
Specifies whether or not to highlight the minimum/maximum points of a sparkline. |
Highlight start/end points |
Specifies whether or not to highlight the start/end points of a sparkline. |