thankQ Help
If the dimension in the Arguments section contains numeric data, the Chart can create either a continuous X-axis or a discrete X-axis
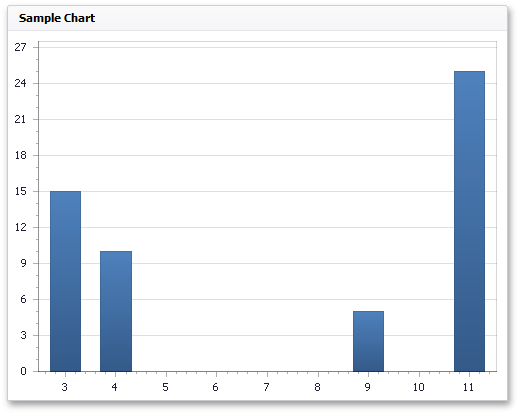
Continuous X-axis If a continuous axis is used, the distance between argument values is proportional to their values
|
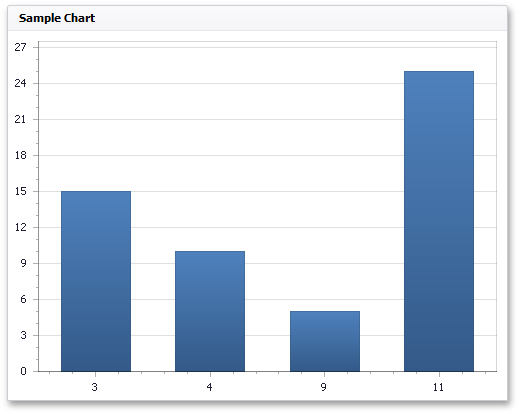
Discrete X-axis On a discrete axis, all argument values are an equal distance from each other.
|
1.Rearrange Data Items to be
Date to Values
Amount to Arguments
Source to Series
2.Click Arguments under the Data tab
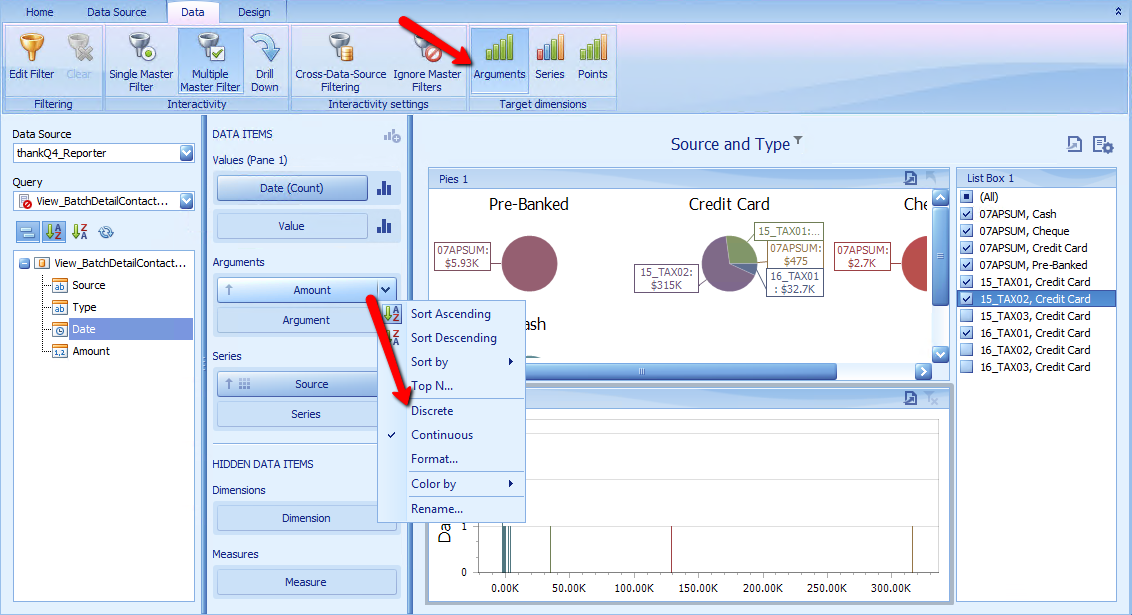
3.Click X-Axis under Design and set Show Title to Default Text, click OK