thankQ Help
Cells in the PivotGridControl display the results of summaries calculated against data fields. Pivot Grid Control supports both automatic and custom summaries. Automatic summaries are always calculated against data fields, while custom summaries can be calculated against any field (including the data fields) or multiple fields at the same time.
Summaries are calculated for a subset of records from the control's underlying data source. All the records in this subset have matching values in a column field(s) and row field(s) and these values are identified by column and row headers.
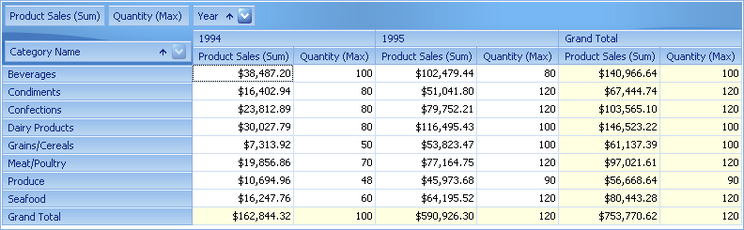
Summary values are displayed within cells in the data area. Consider the following Pivot Grid Control that contains two data fields - Product Sales and Quantity.
The summary value in the left-topmost cell ($38,487.20) has been calculated against the Product Sales field for a subset of records that have the:
•value 'Beverages' in the Category Name field
•value 1994 in the Year field
The summary value in the bottommost cell in the second column (100) has been calculated against the Quantity field for a subset of records that have the:
•value 1994 in the Year field