thankQ Help
The most obvious situation when a hierarchy may enhance a report is when source data contains lookup fields. For example, in the image below, the OrderDetails table contains a lookup field (ProductID) that refers to the Products table. In this case, you need to create a virtual table (a view), which contains fields from one or more real tables in the database. For example, the SalesPerson view contains fields from the OrderDetails and Products tables. In this case, you can display the OrderDetail-Product hierarchy on an axis. Simply drop two headers into the same area to achieve this result. You will be able to browse compact data summarised by trademarks and view details for each car model within a single report.
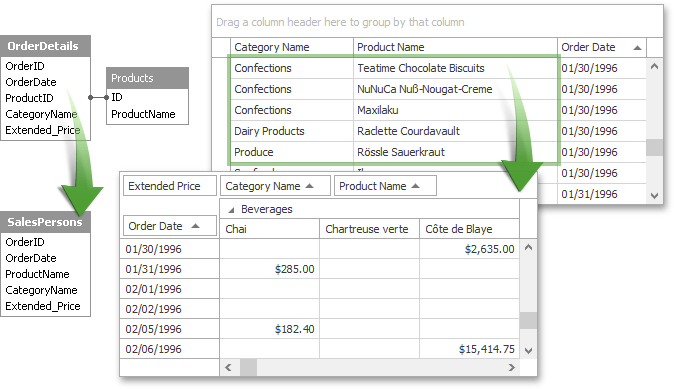
As you can see, the parent value (Beverages) displays expand button that can be used to switch from the "by Product" view to the "by Category" view and vice versa. This can also be done using the built-in field value context menu. Thus end-users can browse rough or sorted data within the same report, and you do not have to redo a single thing in your report.