thankQ Help
Pivot Grid Control Fields represent data source fields and supply specific data to PivotGridControl. Fields are visually represented by field headers that can be moved between a control's areas using drag-and-drop. Dragging fields between the areas modifies the layout of the report.
To create a report in PivotGridControl, Pivot Grid Control fields should be created and positioned within appropriate areas.
A field can be positioned within one of four areas: Column, Row, Data, and Filter Header Area. The field's function is determined by the area in which it is displayed:
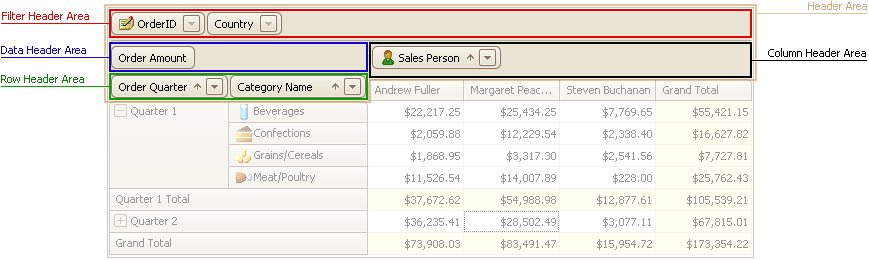
•position a field within the Column Header Area to list its values along the control's top edge. This field's values will represent column headers;
•position a field within Row Header Area to list its values along the control's left edge. This field's values will represent row headers;
•position a field within Data Header Area to calculate summaries against this fields. The summaries will be calculated for all the cells, each cell is identified by a specific column and row;
•position a field within the Filter Header Area to make this field available for further customisations. For instance, it can be dragged to a different area later. In addition, you can filter data against a filter field via the Filter Dropdown.