thankQ Help
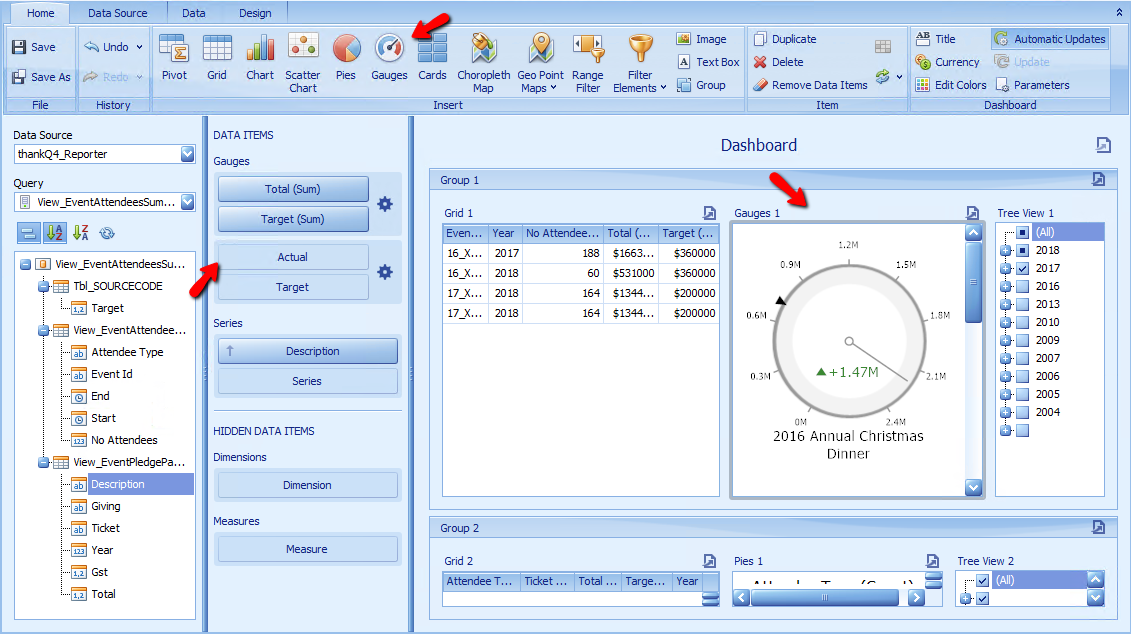
The Gauge dashboard item displays a series of gauges. Each gauge can communicate two values - one with a needle and the other with a marker on the scale.
Video: https://www.youtube.com/watch?v=TXtwPcHCJJE
Section |
Processed as |
Description |
Gauges |
Measure (both Actual and Target values) |
Contains data items used to calculate values displayed by gauges. Data items are arranged in containers. Each data item container can hold two data items. The first item contains actual data and the second item (optional) contains target data. If both items are provided, gauges show the difference between actual and target values. You can fill several data item containers in the Gauges section and use the Values drop-down menu to switch between the provided values. To invoke the Values menu, click the Note: This drop-down menu is available if the Series section is not empty. Otherwise, a separate gauge is created for each data item container, and all gauges are displayed simultaneously. |
Series |
Dimension |
Contains data items whose values are used to label gauges. |
 icon in the dashboard item caption.
1.Right click on the Chart and select Delete
2.Click Guages under the Home tab
3.Reposition in between Grid 1 and Tree View 1
4.Drag Total to Actual and Target to Target
5.Drag Description to Series