thankQ Help
When you setup a Dashboard and add Charts, Grids, Pies etc. the data displayed is the same in each, as it is using the Multiple Master Filter but you can bring in other tables and add Charts, Grids, Pies etc. that use it’s own data by selecting Single Master Filter.
1.Locate and edit the Dashboard created above
2.Add the View_Donations table using Add Query
3.Select the Destination, Source and Amount fields from the Query Builder
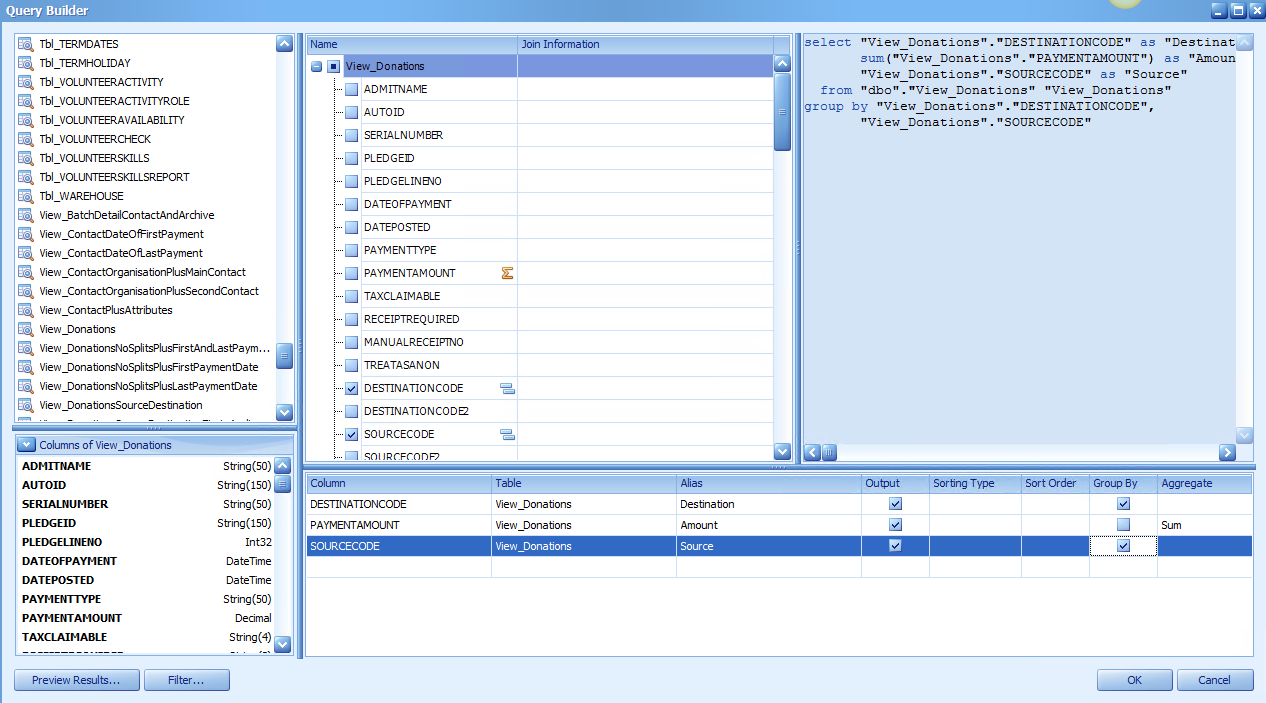
4.Select the View_Donations table
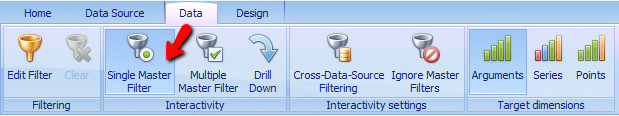
5.Click Single Master Filter from the Data tab
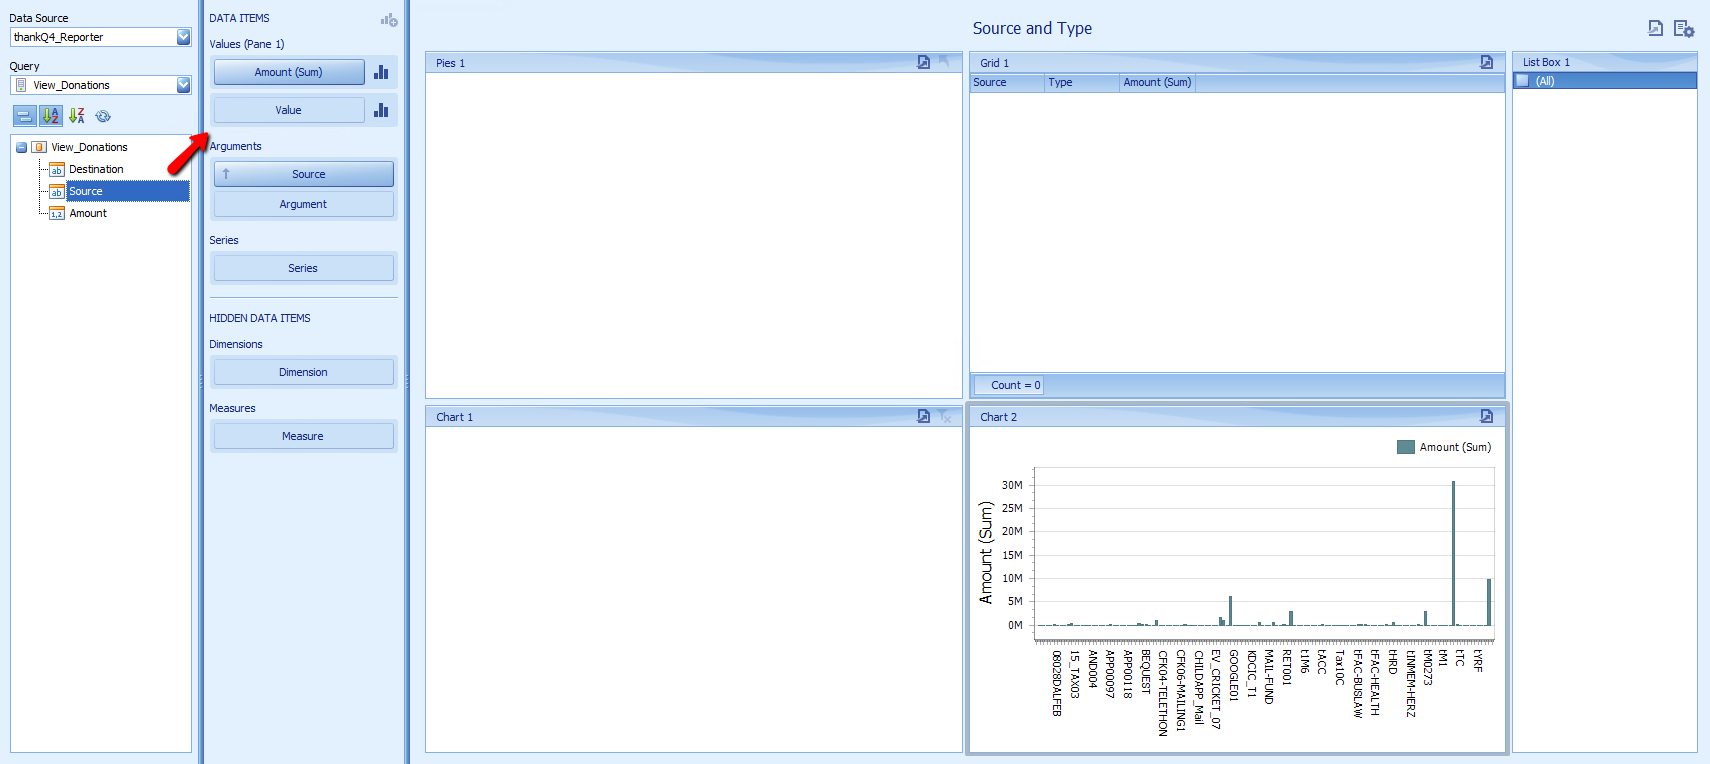
6.Select Chart from the Home tab
7.Drag Amount to Values and Source to Arguments