thankQ Help
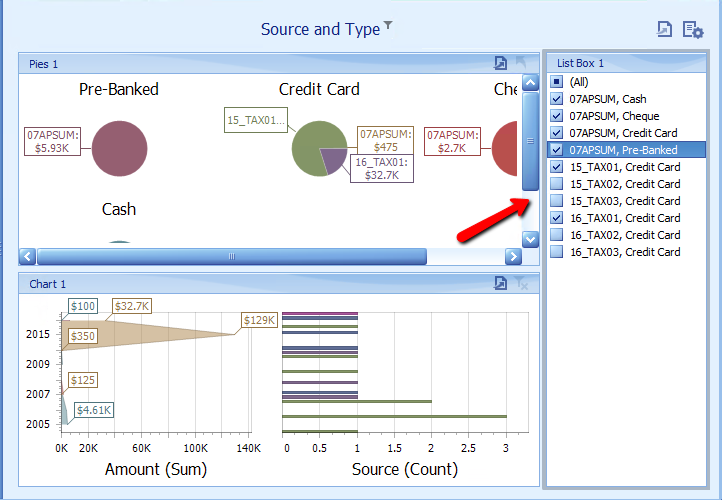
When filtering by series is enabled, a user can click an item to make other dashboard items display only data related to the selected item.
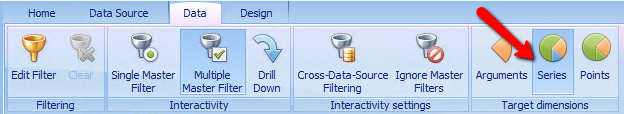
1.Select Series under Target dimensions
2.Click in the List Box and clear all the ticks and then select a few items to view the Pie and Chart change accordingly