thankQ Help
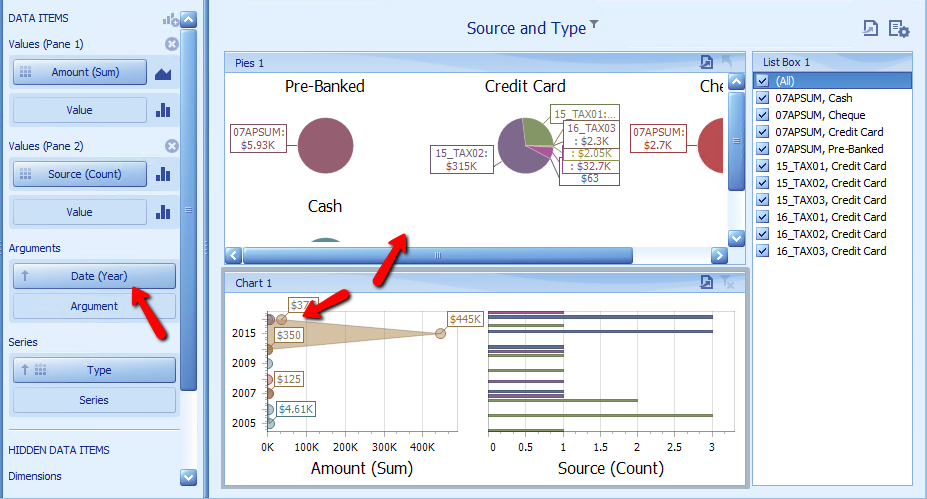
When filtering by arguments is enabled, a user can click a pie segment to make other dashboard items only display data related to the selected argument value.
1.Click on the Pies chart and select to arrange in Columns under the Design tab
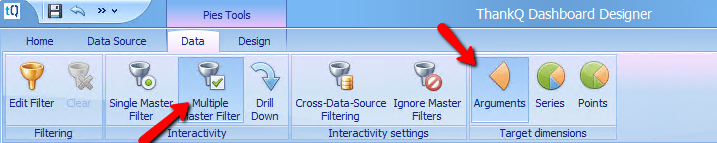
2.Click Multiple Master Filter under the Data tab
3.Select Arguments under Target dimensions.
4.Hover over areas of the Chart and click on a bubble or on one of the graph lines to change the Pie chart accordingly