thankQ Help
Video: https://www.youtube.com/watch?v=iDIj2dyl9fk
The Pie dashboard item displays a series of pies or donuts that represent the contribution of each value to a total.
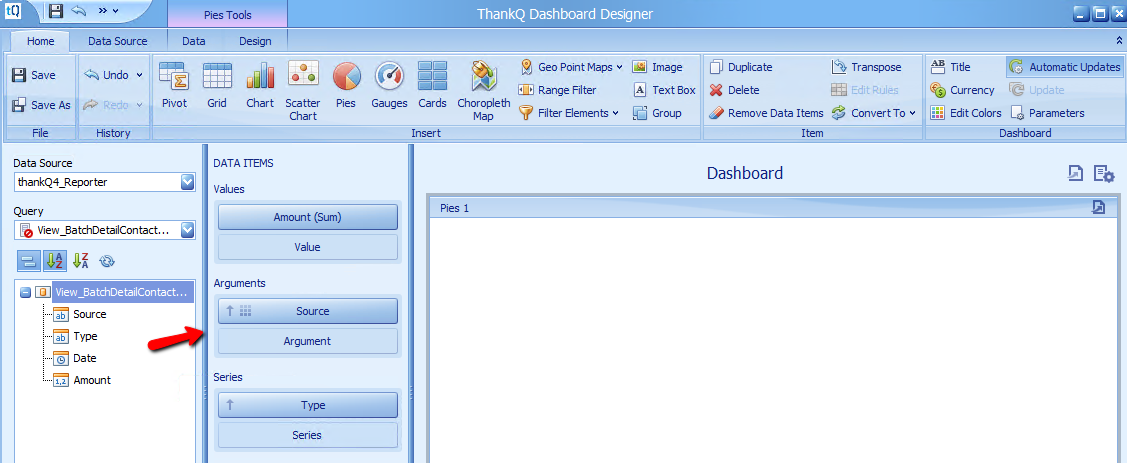
1.Click the icon for Pies under the Home tab
To bind the Pie dashboard item to data, drag and drop a data source field to a placeholder contained in one of the available data sections. The table below lists and describes Pie's data sections.
Section |
Processed as |
Description |
Values |
Measure Measure is used to summarise data against grouped dimension values. These values can be of any type - numeric, date-time or string. The dashboard will calculate an appropriate summary function against measure values. You can also customise the data format settings that affect how summary values are displayed. In case of negative measure values, Pie uses their absolute values. |
Contains data items that define the share of pie segments. |
Arguments |
Dimension Dimension is used to provide discrete categorical information. These values can be of any type - string, date-time or numeric. The dashboard does not summarise the dimension values, but groups identical values. You can perform grouping, sorting, or display the top values for the dimension values. |
Contains data items that provide values used to label pie segments. |
Series |
Dimension |
Contains data items whose values are used to label pie charts. |
2.Drag the fields into the relevant Data Items
Amount to Values
Source to Arguments
Type to Series
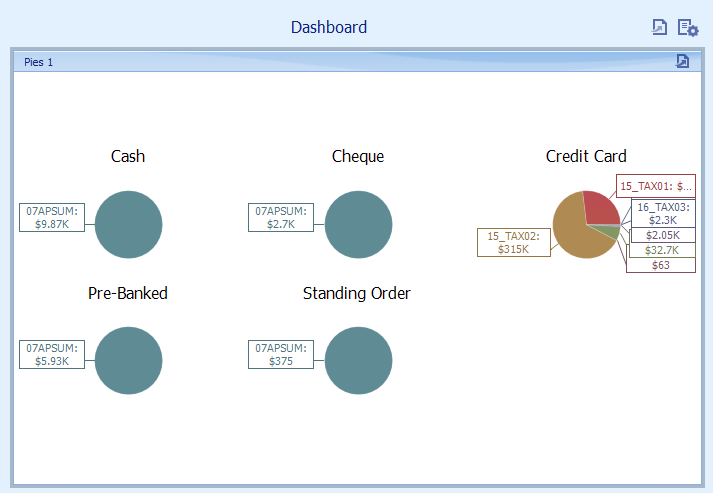
3.Click the Parameters icon at the top of the Dashboard to open the Parameters window
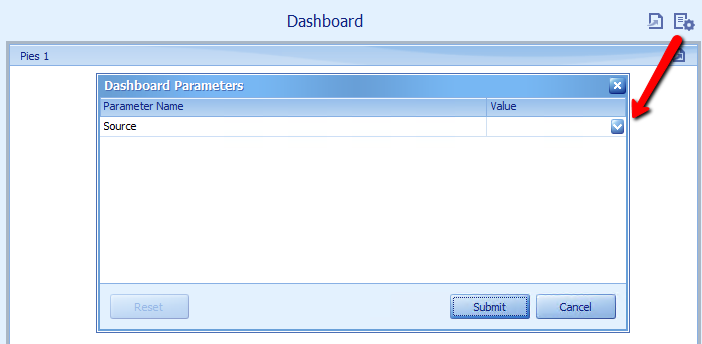
4.Select some Source Codes to display, click OK
e.g. 07APSUM and the 15 and 16 Tax codes
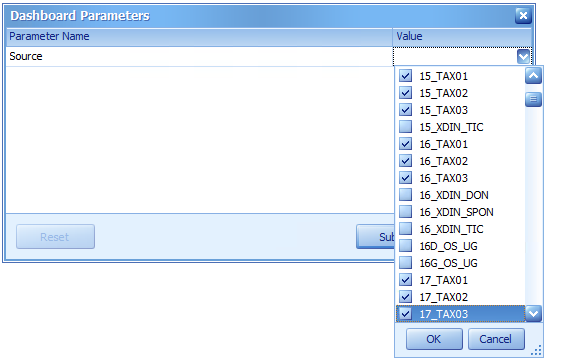
5.Click Submit