thankQ Help
Comparison rules used in conditional formatting can be divided into the following groups.
Format Condition |
Description |
Example |
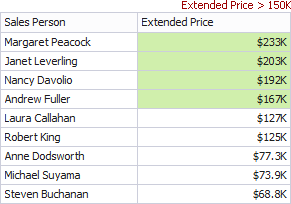
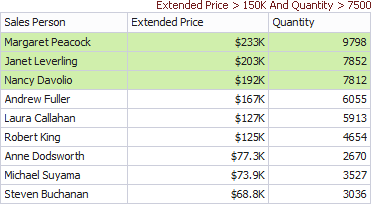
Value |
Allows you to compare static values (such as Greater Than, Less Than, Between, etc.). |
|
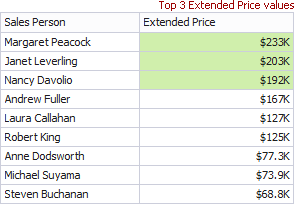
Top-Bottom |
Highlights a specific number of topmost/bottommost values. |
|
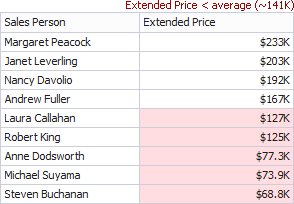
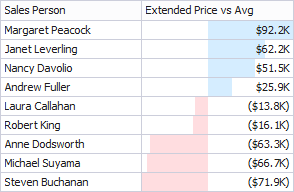
Average |
Highlights values above and below an average. |
|
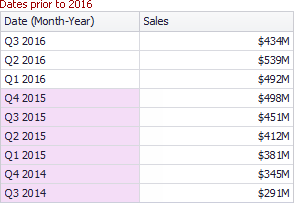
A Date Occurring |
Allows you to highlight date-time values that fall into a specified interval relative to the current date. |
|
Expression |
Allows you to use complex conditions to apply formatting. You can also pass dashboard parameters to expressions. |
|
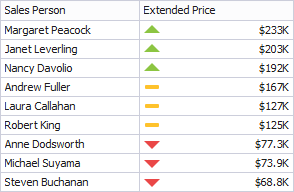
Icon Ranges |
Allows you to apply formatting by displaying specific icons for different ranges of values. You can select a predefined set of icons or use a specific icon for each range. |
|
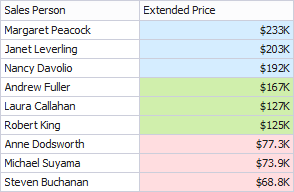
Colour Ranges |
Allows you to apply formatting using specific colours for different ranges of values. You can select a predefined set of colours or use custom appearance settings to highlight values within specified ranges. |
|
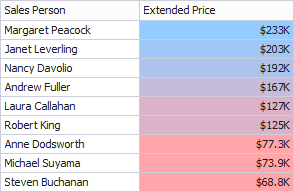
Gradient Ranges |
Allows you to apply formatting using gradient colour scales. |
|
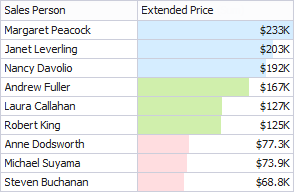
Bar |
Allows you to visualise numeric values using bars. You can also colour bars corresponding to positive and negative values using different colours. |
|
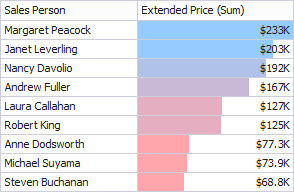
Bar Colour Ranges |
Allows you to visualise numeric values using bars whose colours are contained in the specified colour set. |
|
Bar Gradient Ranges |
Allows you to visualise numeric values using bars whose colours are contained in the specified colour gradient. |
|
You can apply conditional formatting to measure or dimension values. The table below lists format conditions that can be applied to different types of data items.
Data Item |
Supported Format Conditions |
Measure/ numeric |
Value Colour Ranges Gradient Ranges Bar Bar Gradient Ranges |
string Dimension |
Value with the condition type set to Equal To, Not Equal To or Text that Contains |
date-time Dimension |
Value Colour Ranges Gradient Ranges Bar Bar Gradient Ranges |